01 • WHy Navigator
Powered by vision AI based monitoring, Navigator helps operators visualize, optimize and track material processing and recovery

Navigator pinpoints root causes, recommends fixes, and automates recipes. Not just analytics but actions that drive outcomes.

Aware of plant operations, Navigator provides contextualized recommendations and takes defined actions all through a chat interface
Navigator processes data in real time, identifies anomalies before they become an issue, and automates high speed belts and sorting processes.
02 • Vision AI
Navigator draws insights from EverestLabs Vision AI that converts RGB-Depth video stream into real time insights about materials on conveyor belts.
Trained on billions of real world objects, our Vision AI is built to handle extreme variability of objects and conditions found in material processing plants.
03 • The Agents
Navigator never acts autonomously — it recommends, the operator approves. Each agent works a different corner of the function of the plant, and they answer in the same conversation.
Agent 01
Natural-language interface to all plant systems data. Ask a question in plain English, get an answer grounded in your line.
Agent 02
Orchestrates Vision AI output and watches for anomalies — composition shifts, contamination spikes, items that should not be there.
Agent 03
Interfaces with SCADA to apply equipment presets — speed changes, sorter settings, line adjustments — only after you say go.
Operator approval required
Agent 04
Monitors robot and sorting-equipment health remotely, so a developing fault gets fixed before it stops the line.
04 • The Interface
Dashboard
Visualization of key metrics for any line with ability to drill drown.
Artifacts
Prebuilt entities for managing equipment and processes.
Alerts
Receive actionable notifications when thresholds are reached and limits are exceeded.
Chats
"Ask Navigator" is a conversational agent with access to Navigator data and full context and history of your plant.
05 • Use Cases
Each one starts with how the work happens today — and what changes when the plant can talk.
Use case 01 · Audit & material tracking
Problems Operators Face
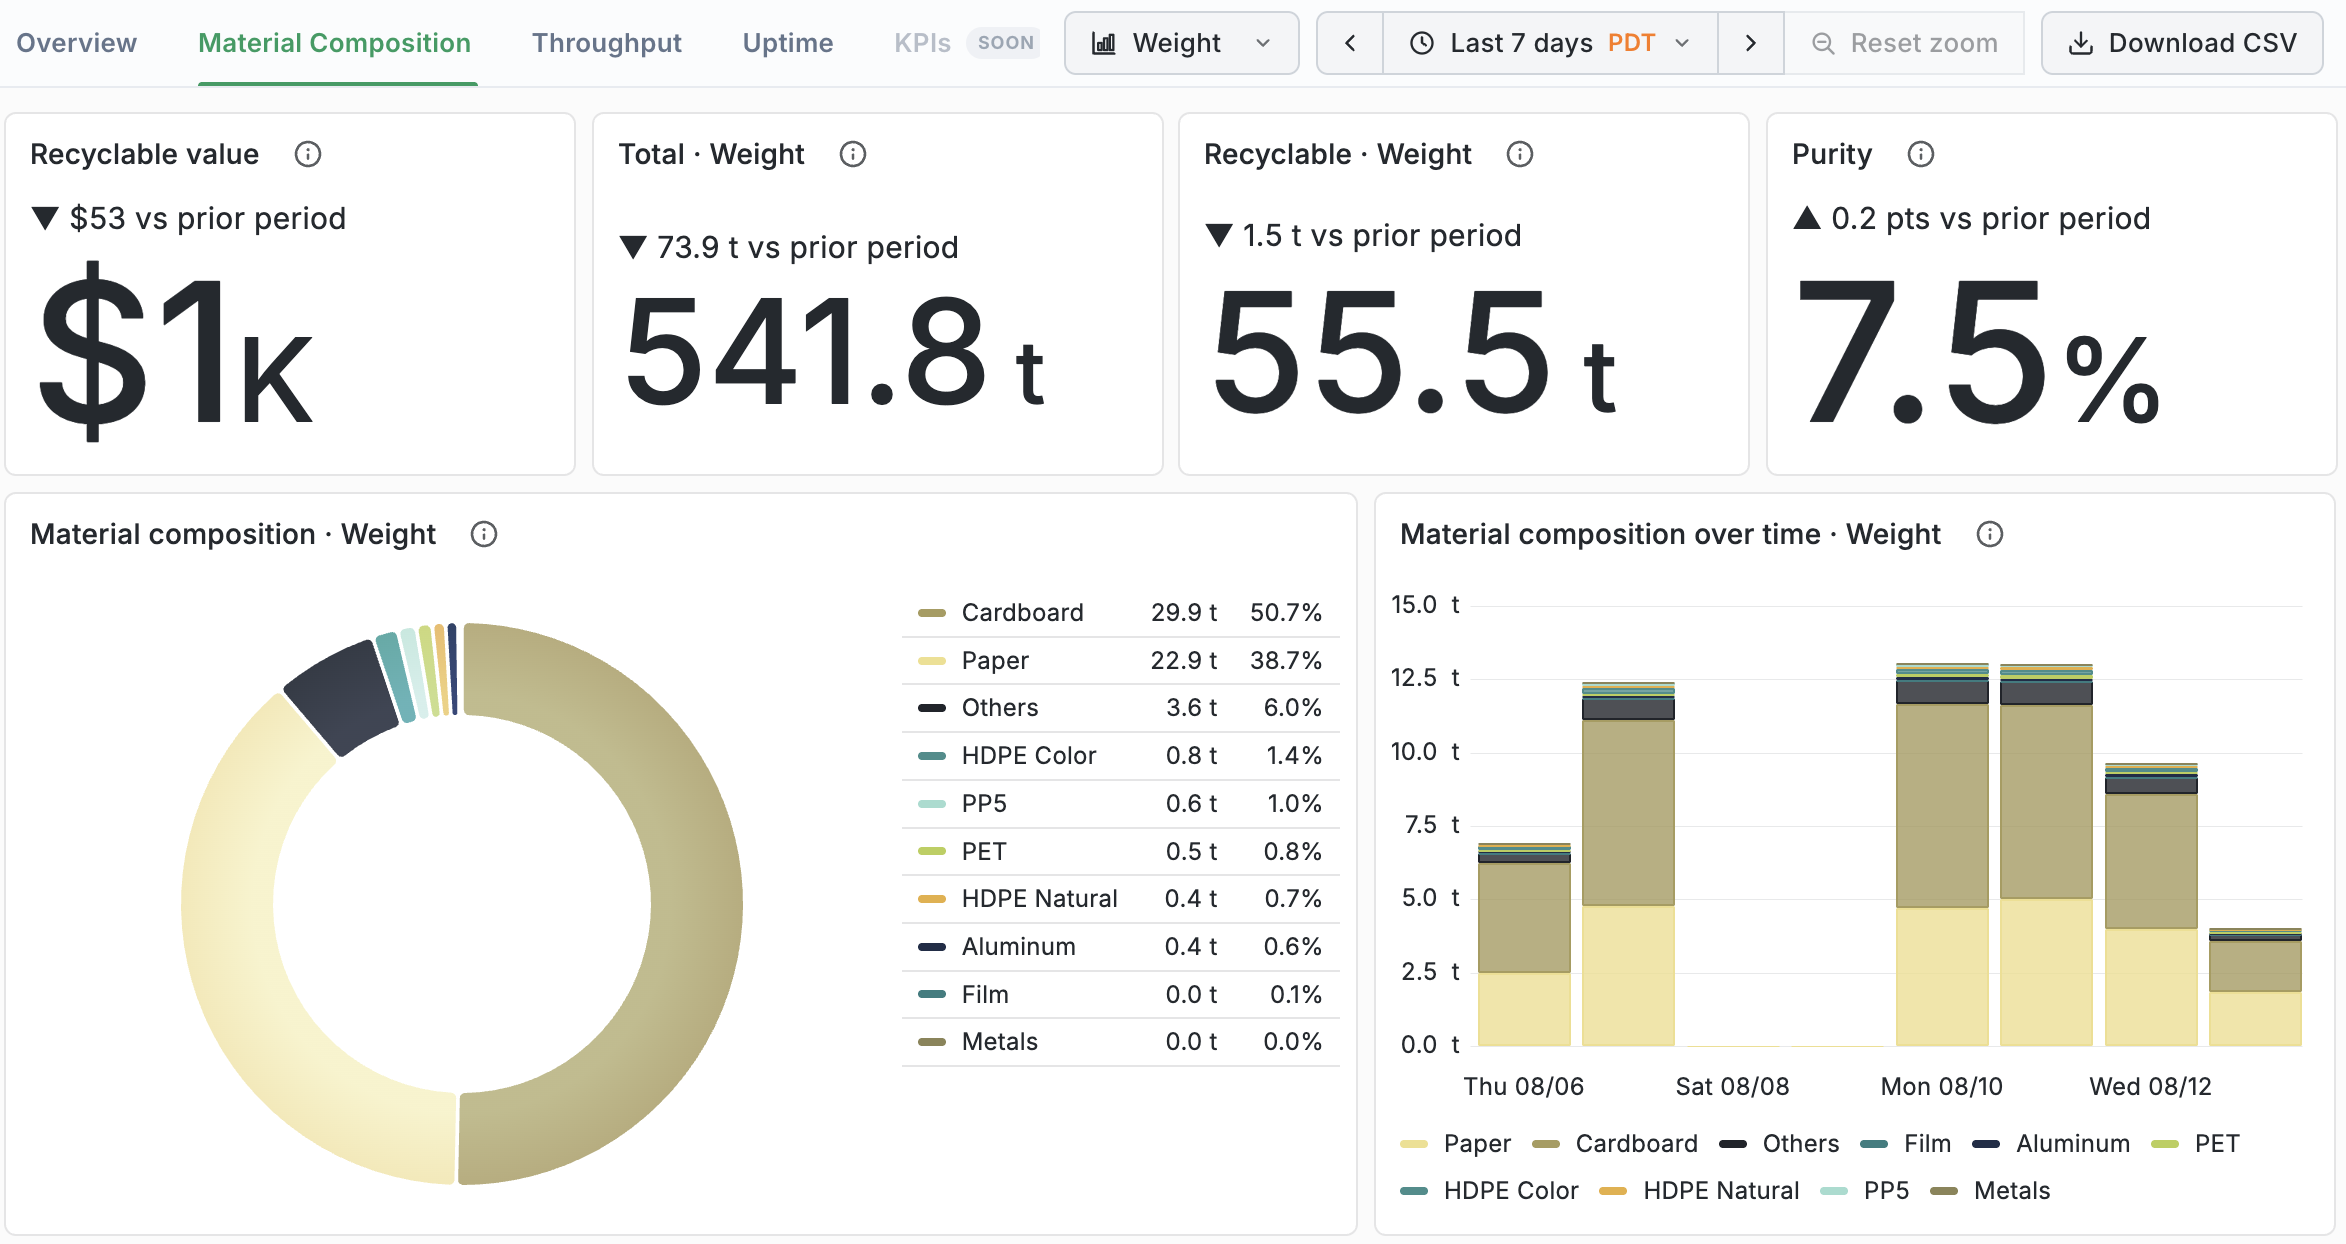
Composition and purity decisions ride on manual spot samples — roughly 0.0003% of the material that actually crosses the belt.
Navigator turns Vision AI's continuous stream into a running audit of every item on the belt — composition, purity, and mass by line, shift, and commodity. 65+ material classes at 95%+ detection accuracy, with new categories added within days. When EPR reporting asks for proof, you have a record built from every item, not a clipboard estimate.
Use case 02 · Recovery optimization
Problems Operators Face
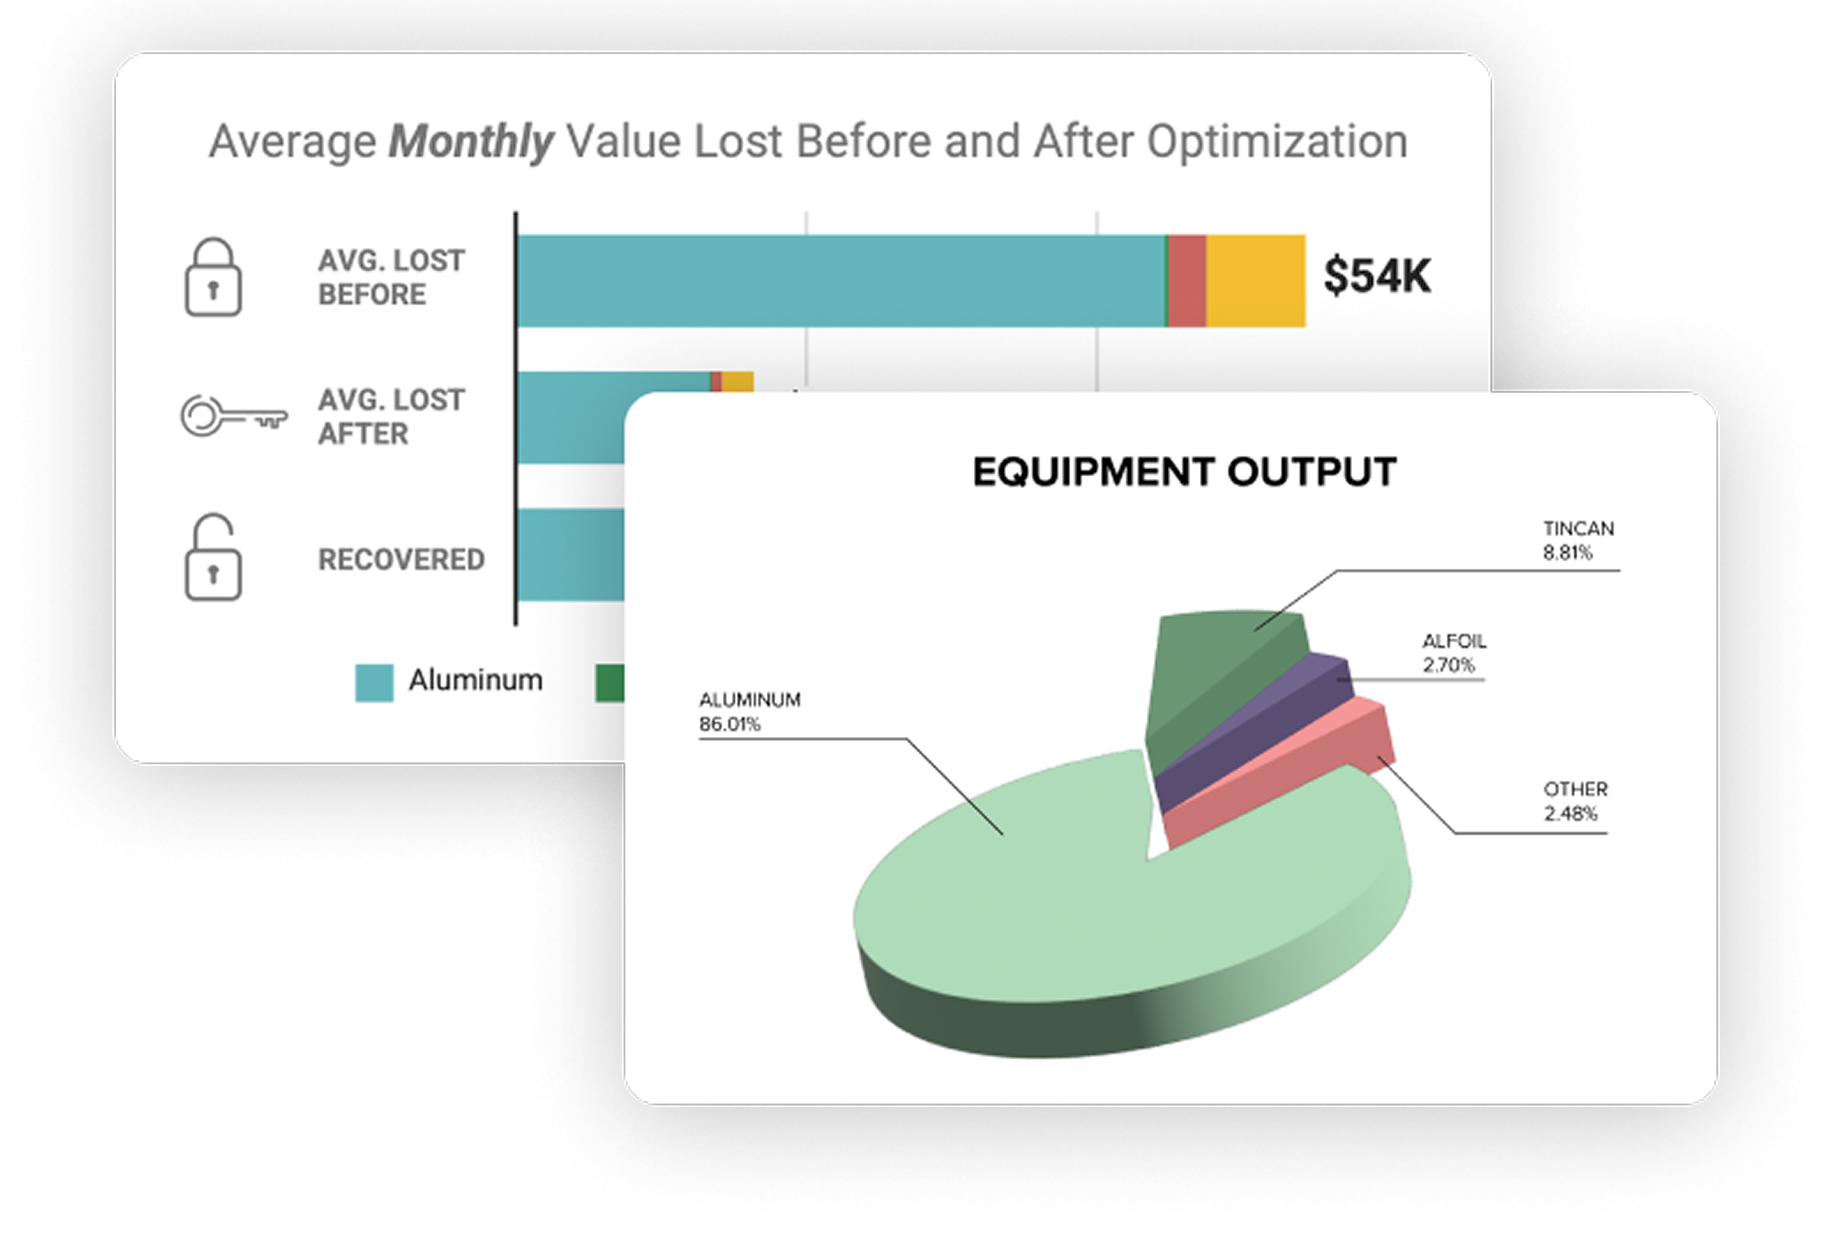
$100–800K of recoverable material is lost to landfill every year at a typical facility — and nobody can say exactly where it slipped through.
Navigator pinpoints exactly where value is escaping — which line, which shift, which commodity — and recommends the equipment adjustments to recover it. Ask where you're losing PET; get a dollar figure, a root cause, and a fix you can approve in one tap.
Use case 03 · Maintenance & downtime
Problems Operators Face
A single belt failure costs 4–8 hours of lost production — and you usually find out when the line stops.
Vision and Fleet agents watch every motor, belt, and equipment for the signatures that precede failure — current draw, vibration, anomaly patterns. Navigator flags the problem, shows the evidence, and schedules the fix on your terms. Across a year, predictive maintenance and downtime prevention are worth roughly $1M.
Ask Navigator
Live
Navigator
Use case 04 · Throughput & yield
Problems Operators Face
Belts average 60–70% utilization. The capacity you need is already on the floor — it's just unevenly loaded.
Navigator balances load across lines in real time, lifting belt utilization past 90% and throughput by 20–40% — no expensive retrofits, no new equipment. For a 400 ton/day facility, that's $2–4M in additional annual revenue.
Belt utilization · Container line
Today
60-90%
With load balancing
90%+
04 • coverage
Navigator starts at the belt and scales up — line, process, then the whole plant.
Audit & Tracking
Recovery Optimization
Maintenance & Downtime
Utilization & Throughput
Material audit & mass estimate
Line analysis
Belt and motor failure
Material audit & mass estimate
OEE analysis for sorting equipment & cell
Equipment automation
Machine anomalies & failure
Belt utilization
Mass Blancing
Plant OEE and MES
Assess Management
Flow Optimization
Plant Digital Twin
Use CAse
Audit & Tracking
Line
Material audit & mass estimate
PROCESS
OEE analysis for sorting equipment & cell
PLANT
Mass Blancing
Plant Digital Twin
Use Case
Recovery Optimization
LINE
Line analysis
PROCESS
Equipment automation
PLANT
Plant OEE and MES
Plant Digital Twin
Use Case
Maintenance & Downtime
LINE
Belt and motor failure
PROCESS
Machine anomalies & failure
PLANT
Assess Management
Plant Digital Twin
Use Case
Utilization & Throughput
LINE
Material audit & mass estimate
PROCESS
Belt utilization
PLANT
Flow Optimization
Plant Digital Twin